Wednesday 29 August 2018

Early Winter Ramblings

I was looking over some QBO(quasi-biennial oscillation) data yesterday and found some interesting tidbits that could prove useful for the upcoming winter forecast. The period between 1983 and 1985 had a very similar QBO progression when compared to this year.

Here is the QBO data since May 2017. Note the timestamp(YYMM) in the 2nd column. 50mb values are in the 4th column from the left and 30mb values are in the 6th. Transition from a positive to negative QBO is highlighted in blue.


Here is the same data from 1983--1985. 50mb and 30mb QBO values during the winter of 1984-85 are indicated in red. The progression is very close to this year.


Note that the 1984-85 winter had a positive 30mb QBO with a negative 50mb QBO. Descending westerly anomalies were prevalent which is also known as the westerly shear phase.


It was only natural for me to take a look at solar data following this find. In turns out that the 1984-85 winter came at a time with low solar activity. We were approaching a solar minimum, similar to today. The graphic below gives you an image of the sunspot cycles I am referencing. The yellow box is an approximation of where we were at that time. I cross-checked with raw monthly data to confirm values.


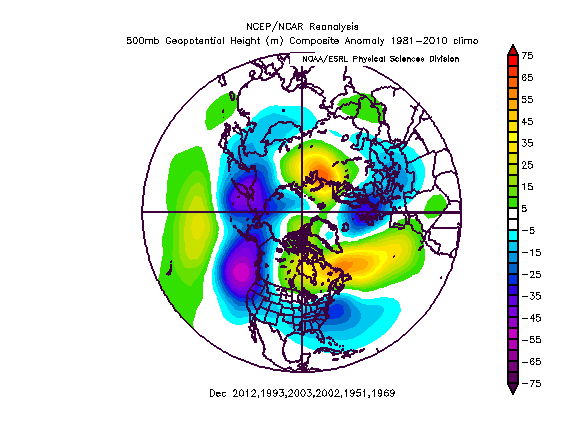
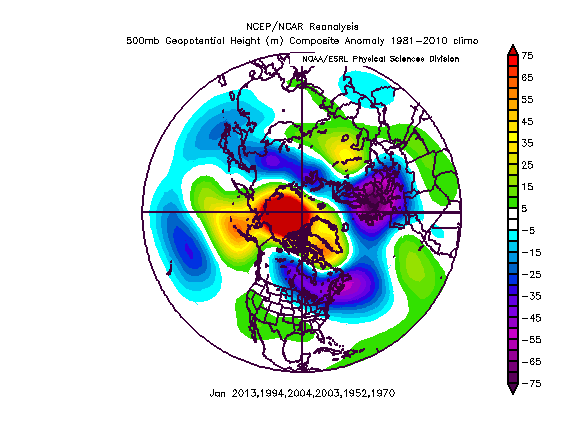
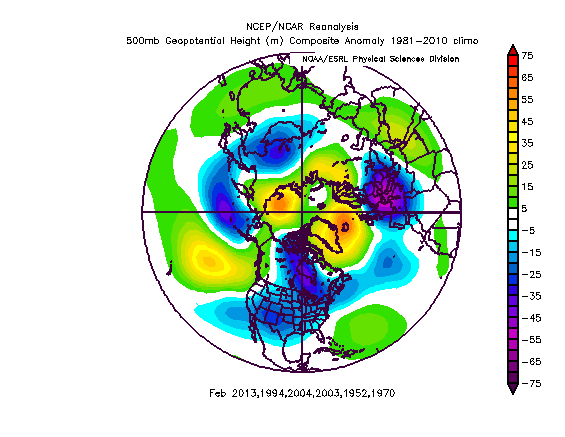
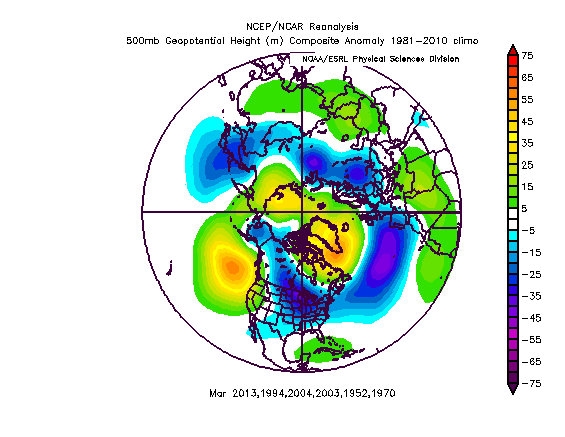
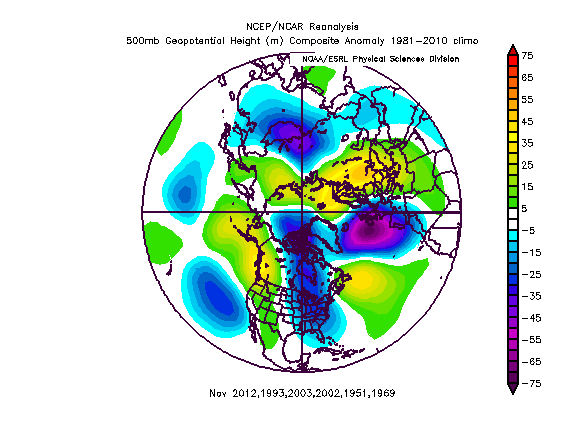
1984-85 had a sudden stratospheric warming event on New Years Day. Here is what 1984-85 looked like at 500mb from January through February:
Surface temperature anomalies across North America:


Europe

That is the potential cold we are talking about as we head towards winter. There are caveats, however. For example, the ONI index in 1984-85 was not a good match to the expected outcome this year. The general consensus is at least ENSO neutral, but likely a weak el nino(west-based) event for this winter. The 1984-85 winter was a moderate-strong La Nina.

Another caveat is that the upcoming QBO/solar phase is not the most favourable couplet. That would occur in a -QBO with downwelling easterlies and low solar activity. 2009-10 had a +QBO with downwelling easterlies. Some research suggests that QBO phase is less important than shear and 2009-10 is an example of this. A major -NAO event dominated that winter.


If the 84/85 match is extrapolated, it is likely that we will experience downwelling westerlies this winter. These have been shown to resist SSW events via the Holtan-Tan effect. These downwelling anomalies help strengthen the polar night jet which contracts the stratospheric polar vortex and inhibits disruption of the vortex. There has also been research done suggesting that La Nina is more favourable for sudden SSW events when coupled with -QBO/weak solar activity. La Nina is not expected this fall/winter.

Another interesting tidbit... the Arctic Oscillation has been very positive this summer despite weak sunspot activity. The correlation between May--August solar flux and 500mb heights is shown below. Note the negative correlation across polar regions which suggests that low solar flux supports higher heights across the arctic(a negative AO). This was the opposite of the pattern we saw this summer.

Correlation

AO index since May 1st


My goal with this post was not to post a winter forecast but to get the mental gears turning with respect to the winter pattern. It is still late August. I do believe that there are above normal chances for a colder than normal winter across the Lakes/East as a result of the weak modoki el nino expected with AMO/PDO near neutral. If AP index can stay relatively quiet(it has been volatile lately), a -NAO becomes more likely this winter. A descending westerly QBO is unfavourable but is only one factor and is why the NAO may be hard to predict this winter. Even if the NAO doesn't cooperate, a modoki nino favours a +PNA so a cold Eastern NA pattern could rely on Pacific help.

Thanks for reading. Feel free to leave questions in the comment section or on twitter(@blizzardof96).

Ethan

Tuesday 22 August 2017

Is a 2017-18 La Nina on the table?

Big changes are possible in terms of the ENSO{El Nino Southern Oscillation} trend heading into the fall. Based on the definition used by the latest version of the ONI{ERSSTv4 dataset}, the last La Nina event spanning an entire winter season{NDJ, DJF and JFM} occurred during the winter of 2011-12 and 2010-11. While last winter did enter weak La Nina territory{ONI between -0.5C and -1.0C} it peaked in the fall and did not last through meteorological winter{DJF}. It has clearly been a while since the last legitimate La Nina event during a winter season.


ONI ERSSTv4 Data courtesy of the Climate Prediction Center


Over the next 10 days, low level easterly winds are forecast to intensify near levels observed during the Late July event. The late July event had 850mb zonal wind anomalies near -7m/s.

Image courtesy of Michael J. Ventrice

As a response to the late July event, SST's took a clear dive along the equatorial pacific. Further dips occurred in August due to subsequent EWB's along the equator.

Image courtesy of Tropical Tidbits


The GFS forecast has slightly weaker anomalies{relative to the July event} but a larger radial coverage along the equatorial pacific basin. This could lead to another strong decrease in ENSO anomalies. We may approach SST levels that haven't been observed in several years.

Image courtesy of Michael J. Ventrice


The Latest weekly ENSO dataset {valid Aug 16} is listed below. A weekly Nino 1+2 anomaly has not been this low since February 2015.

Nino 1+2: -0.7C

Nino 3: -0.5C

Nino 3.4: -0.5C

Nino 4: 0.1C


From an atmospheric point of view, the La Nina response is beginning. GLAAM initialization is already less than -1sigma and is forecast to dip below -2sigma in the 10-14 day period. SOI values have been positive every day in August with the exception of 4. The 90 day mean continues to climb to the highest value recorded in months. With a July monthly mean of 6.51, August will likely come in higher with the upcoming EWB. It could surpass 13.90, which is the highest monthly value recorded since December 2011. This is unlikely at this point given the time remaining in August.

At this point in time, most of the climate models have a La Nada event. The CFSv2 has a weak to  moderate La Nina. It is an east/central based event which is more favourable for a cold winter{midwest/east} when contrasted with a modoki event.

In my opinion, most of the other climate models{e.g ECMWF, JAMSTEC} are playing catch up with regards to the current observations going on across the pacific basin. The August update from the ECMWF monthly had a majority of members with a (+) Nino 3.4 anomaly during winter. It forecasted an august mean near 0 which is going to end up significantly too high. The UKM/JMA trended colder with their latest updates, depicting continued easterly trades in the SON period. If trade winds dominate, a La Nina is likely given the subsurface anomalies in place.

Trade winds are forecast to remain moderate through the first two weeks of September. Valid 8/22--8/28, 8/29--9/4 and 9/5--9/12.

The subsurface cold pool is evident and will continue to upwell slowly as easterly trades continue.


 This could be one of the rare times where the CFSv2 scores a coup. Because its SST forecast updates on a weekly basis, it is more likely to respond to changes going on in the pacific. It has been consistent with its SST forecast and has support from observations. Monthly climate models could be steering in the wrong direction and it is making me question the extent to which the ECM/JAMSTEC forecasts{Aug updates} are useful going forward.

Friday 24 October 2014

Winter Outlook Update: Brief Summary of Thoughts


Based on the research i've been doing on the upcoming winter here is my revised forecast. I will keep it to a brief summary of my thoughts. I want to note that I am expecting a weak nino, with a -QBO, SSN ~80-100, +PDO, +AMO and weak walker cell.

November
- Following chill in the first few days of the month, warmer then normal conditions are expected overall in the first ten days of the month with a -PNA and trough axis along or east of the East Coast. 
- RNA pattern continues in weeks 2-4 with a SE ridge and trough axis over northern rockies and plains. Storm track active through the great lakes. Potential for early season snow's across Ontario and Quebec when anticyclonic waves break into Alaska sending arctic air into the plains/prairies/Lakes. Tropical forcing shifts into phases 7-1. Overall month near to slightly above normal temperature wise with above normal precip across On, Que. Below normal across B.C with above normal precip.

December
-Classic El nino look with a Very -PNA and neutral EPO(SE GOA low with Poleward Aleutian High). Ridge axis over rockies/plains with NW flow dominating ON/Que. Secondary trough off the east coast/maritimes area.
- Below normal Temperatures expected for Toronto, Montreal, Ottawa and Vancouver. Below normal snowfall across Eastern Canada(YYZ,YUL,YOW) and the Great Lakes(outside of the LES belts). Above normal snow across B.C.
- Neutral NAO with +AO.
 
Attached Image
January
- Very -AO/NAO with a SSW expected. Well Below normal temperatures across the N Plains, Lakes, and New England including S/E On, S Que and B.C. Secondary trough east of the East Coast.
- Negative PNA with Eastern Lakes/Interior storm track in the means. N-S temp gradient across the U.S with above normal temps in the Southern Plains, Miss Valley and Southeast.
- Above normal snowfall across Southern Ontario, B.C and Alberta. Near normal E On/S Que. Below normal snowfall NE of YOW-YUL including Atlanta Canada with blocking HP dominating.
 
Attached Image
February
- Negative PNA continues with +WPO and Strong Bering Sea low. Trough axis off East Coast remains stagnant. 
- Slightly -AO/NAO.
- Above normal snowfall across the Pac NW, SW U.S and SE U.S. Near to slightly below normal snowfall across the great lakes, S and E Ontario and Quebec.
- Dry/warm conditions over the priaries.
- Above normal snowfall across the Maritimes if -NAO backs off. Otherwise, snowfall remains below normal.
- Below normal temps across the GL's although suppression is an issue.
 
Attached Image
March

- Strong NE Pac high forms off the W coast of B.C. PNA spikes positive although core of the ridge axis is west of the PNA and SE of the EPO region. +PNA/-EPO means that cold tongue forms from the NWT through the plains and all the way to the SE U.S. 
- Core of cold over N Plains/Western Great Lakes. Well below normal temps for YYZ,YOW and YUL. Warmer then normal temps across S B.C.
-Negative NAO/AO returns with above normal snowfall across the eastern lakes, northeast and mid atlantic as well as the maritimes. Above normal snowfall across YYZ/YOW/YUL.
 
Attached Image

In summary for On/Que... winter will start off relatively slow in the snow department following a November full of potential if the storm track is not positioned too far West. December should end up below normal temperature wise especially across S Ontario and S Que. January and March have the most potential to carry above normal snowfall across ON/Que in addition to well below normal temperatures. February is slightly colder then normal but relatively benign in the snowfall department with suppression and a NW flow.

Analog Years...
Mar
Attached Image
Feb
Attached Image
Jan
Attached Image
Dec
Attached Image

Any questions? Feel free to shoot away. 

Monday 20 October 2014

Winter Possibilities: Canadian Warming v.s No Canadian Warming

Couple December scenario's I want to outline this evening.

Case 1: -QBO/El Nino Years following a November Canadian Warming. If the increased polar ozone, stronger BDC and nino help keep the wave activity high enough we could see one. 4 of my analog years have this setup but we would need to see major wave breaking pretty quickly.

Attached Image

Case 2: No November CW. My analogs are hinting at a classic Nino look with a warmer then normal N and NW with cooler anoms limited to the EC/South. The S Plains look too warm however.
Attached Image

As we head into Jan note how both the CW years and regular analogs have a similar pattern. Jan is probably the highest confidence month for me given the likelyhood of a Major SSW by then. Note the major AO reversal in Jan(makes sense given the OPI,SAI,Nino,-QBO and moderate solar).
CW Years
Attached Image

Regular Analogs
Attached Image


Feb CW Years(Note the reversal across the plains and NW to significantly warmer). Interesting how they tend to be colder early on but the opposite as you get latter into winter.
Attached Image

Regular Analogs
Attached Image

Have a good night!
Ethan

Sunday 19 October 2014

Warm November coming up for the East, Plains and Lakes?

A few very important things i'm noticing this morning that should be pretty important for the November forecast. A Poleward/weak NH Hadley Cell has developed(especially near Indonesia) and is making it very hard for trough's to amplify across the SE Asia/Japan sector all the way through D10. This is having major impacts downstream across the CONUS because it makes it tough for waves to breakdown the C NA ridge. Instead they get displaced well to the NE towards atlantic Canada and New England.

E Asian Jet Forecast:

 Reduced 38%
Attached Image
1024 x 768 (214.7K)


500mb Omega:

 Reduced 65%
Attached Image
1826 x 562 (204.03K)


This entire pattern coincides with an H5 setup that is very supportive of poleward propagating anticylones into the mid latitudes with +AAM anomalies into the subarctic(50N-70N region). This is supportive of a major spike in the AO which should occur shortly.

 Reduced 47%
Attached Image
1200 x 600 (63.57K)


Until the hadley cell returns to normal, E asian cyclogenesis will remain sparse and the NPAC jet will favour waves breaking into Bering Sea with a -PNA. This in conjuncture with classic Basin Wide nino forcing is helping amplify the GOA trough. At the same time we will see little help from the NAO region until very late Nov or December in my opinion. I do think there is a window for some chill in the 10-15 as the GWO is pretty strong right now and headed for nina like phases(we'll see if its enough to shift the C NA ridge South and East). Beyond that point it should get pretty "torchy" from the Plains to the EC(especially the further N you go) until forcing can shift into the W-C Pac to W IO sector. In other words, it looks like Nov could be less nina like and warmer then normal across the lakes/plains/NE(with the exception of extreme Northern New England and the Maritimes). It's all part of the seasonal progression that should bring us towards a cold DJFM period over the central/Eastern CONUS. Have a great day!

Thursday 9 October 2014

Winter Analog's Revised-- looking good for Ontario!

Just went through and revised some of my analog years yesterday, coming up with 51-52,69-70,02-03,03-04,93-94 and 12-13 in the set. Mostly focused on monthly SSN/QBO/MEI numbers with some focus on PDO,AMO,ONI lead up, ENSO configuration, Walker Cell etc. These years appear to hint at a cool and very nino like start to winter with a more nina like finish as the el nino weakens and -EPO forcing takes over. This would more then likely cause the storm track to shift into a more favourable position for our region with the presence of a weak SE ridge. Based on my analogs/research Jan-Mar should be the month's to watch for average to above average snowfall which actually contradicts the modelling(NMME/Euro) which have a wetter/stormier dec and more suppressed storm track from Jan-March.

Dec has that RNA,+WPO,+EPO and neutral NAO/AO look:
_PhOrHCBgh.png

Jan(-EPO,-WPO,-AO/-NAO):
TG7NscG5_C.png

Feb(-NAO/AO,-EPO,+WPO,+PNA)
owKEwyNg_3.png
March(+PNA,-WPO,Neutral EPO,-NAO/AO)

pgNoEzuOrL.png
Oh and maybe we can pull off a snowy november finally... very exciting times ahead.
qgWZDNkNEV.png

Saturday 6 September 2014

Spetember 9-11th Severe Weather Potential

Hello everyone and welcome back to the Severe Weather Centre. I've been keeping a close eye on the models lately and have been quite impressed with some of the severe weather parameters for this upcoming Wednesday across MI,IN, IL, OH and S On. Subtropical moisture will get drawn from Norbert's circulation off the West coast of Mexico in addition to an upper level low which is expected to spin off the B.C coast for several days. Note the two features on the latest run of the GFS(18z initialization).

By Monday evening this upper level low will come inland, crossing the Northern California coast and taking a track through the rockies and up towards Lake Superior. This will try to partially phase with an area of vorticity currently located across Nunavut, which will cause anomalous deepening of the low pressure area for this early in the fall. The euro goes as deep as a 982mb low centre near Sault St Marie Wednesday night while the GFS/CMC are a little faster and weaker with the SLP centre, albeit still very impressive.

18z GFS

12z Euro


 This deep low pressure area creates a very impressive kinematic environment with a 45-55kts LLJ across parts of MI, IN and NW OH. This jet strengthens even further after sundown with a 60-65kts jet max across S On late wednesday evening.

GfS model 850mb wind field valid 6z Thursday 

Really impressive low level speed/directional wind shear in a sounding near guelph, On. Notice the strong clockwise turning, small T/td spreads and extreme water loading/saturation.
 The sounding lacks instability and steep mid level lapse rates, however.


 These winds will be accompanied by a 90kts upper level jet streak nosing SE with strongly backed sfc flow out ahead of the front. PWAT values are in access of 2" across a widespread area.
GRR had this to say in this afternoon's discussion. Very interesting.

"THE RETURN INTERVAL FOR THE MEAN SEA LEVEL PRESSURE AS THE
SYSTEM MOVES THOUGHT THE GREAT LAKES IS ABOUT 1 YEAR IN 10. THE
PRECIPITABLE WATER RETURN INTERVAL IS GREATER THAN 1 YEAR IN 30 FOR
THE 10TH-11TH OF SEPTEMBER. SIMILARLY THE 850 TEMPERATURE ANOMALIES
ON THE COLD SIDE OF THE SYSTEM (NEAR ZERO) ARE AROUND ONE YEAR IN 5
FOR THAT TIME IN SEPTEMBER."

CAPE's do appear to be lacking on most of the models, with a general 500-1000j/kg on most modelling across IN/IL with little to no CAPE further NE. This, along with timing are going to be huge players for S On as a faster vort ejection will increase the chances of a more significant outbreak although super cells will likely continue well after sundown as the low level wind fields continue to intensify. Keep in mind, the models due tend to underestimate WAA at this range so a trend upwards in the instability department is likely as we edge closer to the event. Right now, I'm in agreement with the SPC outlook in terms of the areas likely to be effected. If modelling continues showing the dynamic's it has been showing, a dangerous situation is possible for S On from Windsor through the GTA, including much of SW Ontario. On the other side of the border Michigan, NW Ohio and Indiana are at risk of severe weather. Primary threats appear to be high precip super cells with strong winds, flooding potential and possible tornadoes. I'll keep you posted on twitter in the days ahead!